Skip to main content
Menu
Toggle menu
Mobile main navigation
Home
Leisure
Explore | Play | Events
Parks
Regional Parks
Community Parks
Recreation Centers
Book an Event
Outdoors
Beaches & Bays
Golf
More Leisure
Balboa Park
Torrey Pines Golf Course
Special Events & Filming
Arts & Culture
Resident Resources
Pay Now | Parking | Help
Neighborhoods
Community Plans
Recreational Activities
Pools
Street Maintenance
Potholes
Street Sweeping
Streetlights
More Resident Resources
View/Pay Water Bill
View Trash Collection Schedule
Parking Citations
City Strategic Plan
Doing Business
Fix | Plan | Build
Plan
Bid on a Contract
Explore Incentives
Development Codes & Regulations
Fix
Set Up Utilities
Renovations & Remodels
Build
Get Permits
Track Your Project
Learn about Zoning
More Doing Business
Business Tax Certificate
Five Key Steps to Starting Your Business
Library
Learn | Connect | Discover
Programs & Events
One Book, One San Diego
Event Calendar
More Programs & Events
Services
Fines & Fees
Renewals & Holds
More Services
Kids & Teens
Homework Help Center
Parents & Teachers
More Kids & Teens
eCollection
eBooks
Digital Magazines
Library Website
Browse the Catalog
Apply for a Library Card
Employment Opportunities
Public Safety
Police | Fire | Lifeguards
Police
File a Police Report
Police Services
Join SDPD
Police Website
Fire-Rescue
Community Outreach
Community Risk Reduction
Join Fire-Rescue
Fire-Rescue Website
Lifeguards
Beach Safety
Junior Lifeguards
Lifeguards Website
More Public Safety
Neighborhood Watch
Get Emergency Alerts
Office of Emergency Services
City Hall
City Officials | Departments
City Officials
Mayor Todd Gloria
Councilmembers
City Attorney
City Auditor
City Clerk
Independent Budget Analyst
City Government
Departments
Programs & Initiatives
Boards & Commissions
City Organization Chart
More City Hall
Council Meetings
FY27 Draft Budget
Council Committees
The People's Business
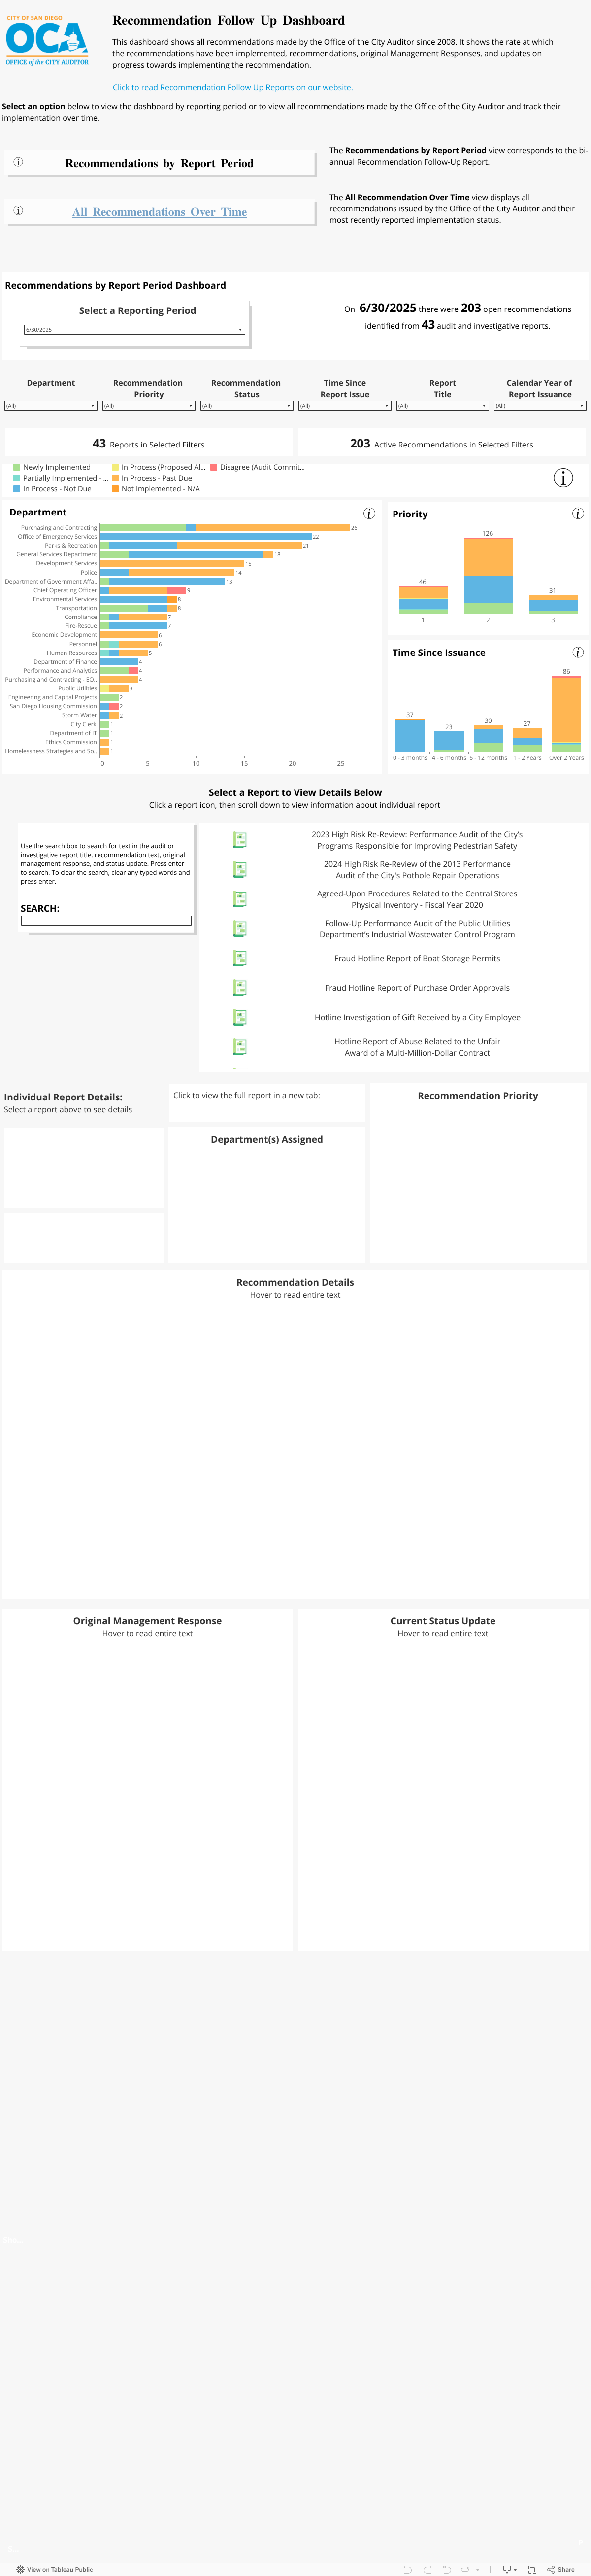
Recommendation Follow Up Dashboard
Recommendation Follow Up Home