Underrepresented Groups
Local Demographics
The information below can be used to understand existing City demographics or more localized data for a project area. Understanding the demographic makeup of San Diego creates a baseline that allows the City to identify who may be missing from public engagement processes.
Important: As the datasets on this page are provided by external organizations, please note their availability and content are subject to change. The guidance provided here is accurate as of the date of publication, and specific steps required to retrieve information may be subject to change.
Citywide demographics
Below are a series of charts and tables that represent current demographics of the city of San Diego based on the 2024 American Community Survey (ACS) administered by the United States Census Bureau.
The ACS provides data every year about America’s people, places and economy. Find out more U.S. Census Bureau data on San Diego by visiting the city’s census profile. For information on languages spoken across the city or within a community, please reference the Translation and Interpretation page in the Communicating with the Public section.
Table 1: Race and Ethnicity Toggle Table 1: Race and Ethnicity
Table 2: AgeToggle Table 2: Age
Table 3: Education Toggle Table 3: Education
Table 4: OccupancyToggle Table 4: Occupancy
Table 5: IncomeToggle Table 5: Income
Table 6: Housing TypeToggle Table 6: Housing Type
- Definitions for the Housing Type categories are as follows:
- 1, Attached: A residential building that shares at least one wall with another property, but is still considered a single unit, like a townhome or rowhouse
- 1, Detached: A residential building that does not share its walls with another property
- 2 or more Units: Residential buildings, like apartments, condominiums, or single-room occupancy complexes, that contain units built one on top of another and/or have common facilities
- Mobile Home: A prefabricated structure, transportable in one or more sections, to be used as a temporary or permanent residence
- Boat, RV, Van, Etc.: Any living quarters occupied as a housing unit that does not fit the previous categories
How to find community-level demographic information
The San Diego Association of Governments (SANDAG) releases datasets based on the U.S. Census. This data allows for easy cross-reference of a limited subset of Census data points to local, more specific geographies not always provided by the Census Bureau.
Guidance is provided below on how to retrieve demographic information for geographic areas like a community plan area or Council District. City staff can consult with the Performance & Analytics Department for more detailed information or assistance.
- Navigate to the Census dataset
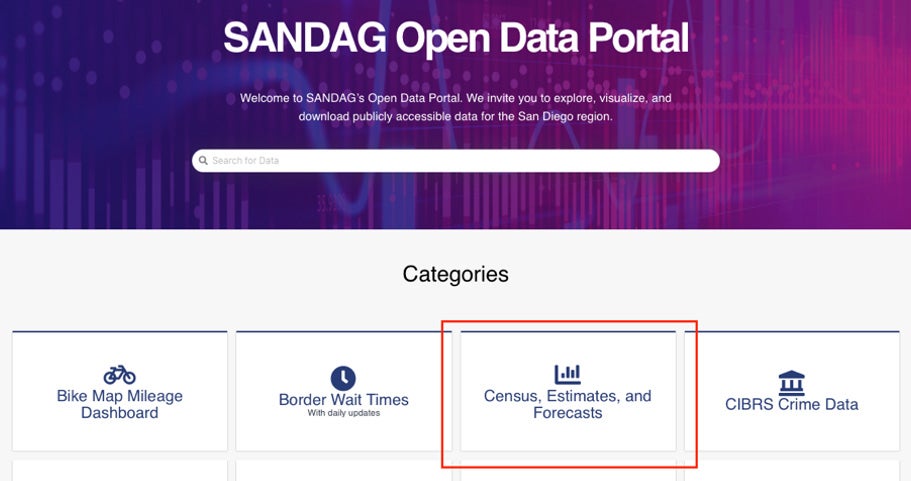
- Visit the SANDAG Open Data portal
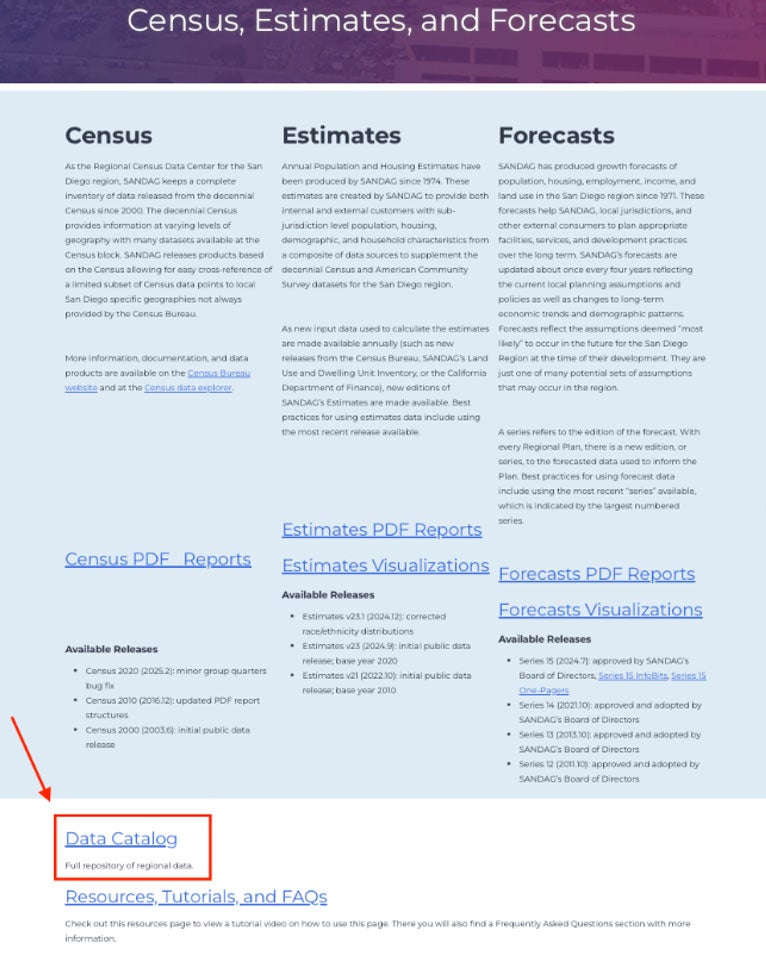
Retrieve the Census data by navigating to "Census, Estimates, and Forecasts."
- Determine the data format needed
- SANDAG currently publishes Census data in PDF (graphic) format that can be viewed in an Internet browser, and csv (tabular) format that can be analyzed further in software like Excel or Google Sheets. The type of analysis staff will conduct will determine which format works best.
- To retrieve quick facts about certain demographics for a single geographic area, the Census PDFs may work best. (Go to Retrieving Census PDF-format data)
- If staff will conduct a more in-depth analysis, or compare multiple geographic areas for analysis, the csv/tabular data may work best. (Go straight to Retrieving Census raw tabular data)
- SANDAG currently publishes Census data in PDF (graphic) format that can be viewed in an Internet browser, and csv (tabular) format that can be analyzed further in software like Excel or Google Sheets. The type of analysis staff will conduct will determine which format works best.
- Retrieving Census PDF-format data
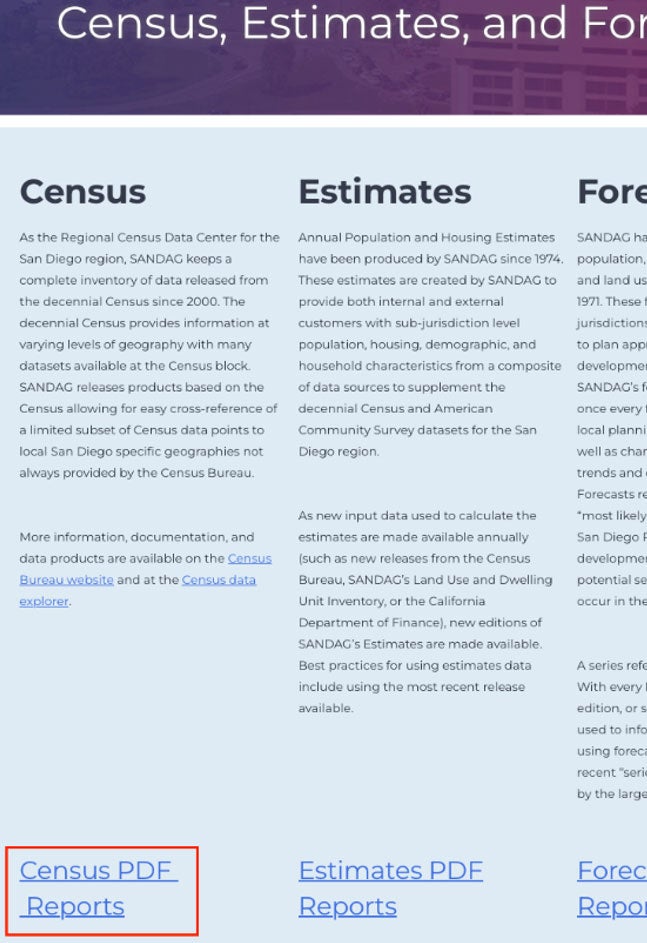
From the 'Census, Estimates, and Forecasts' page, click "Census PDF Reports".
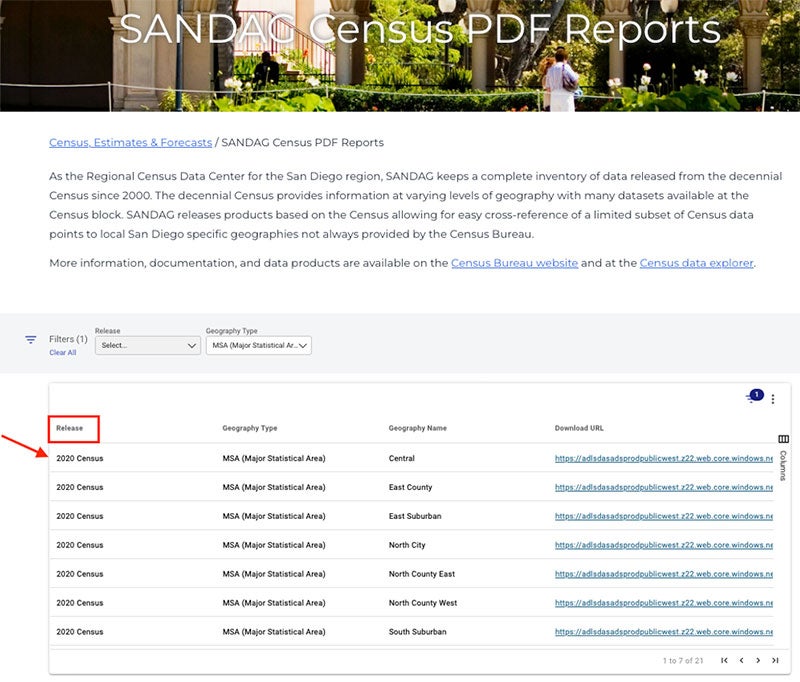
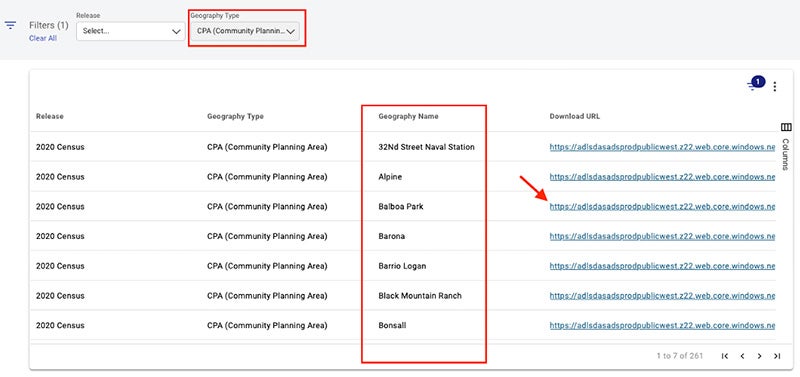
Verify that the most up-to-date Census data is being displayed by checking the ‘Release’ column in the data viewer.
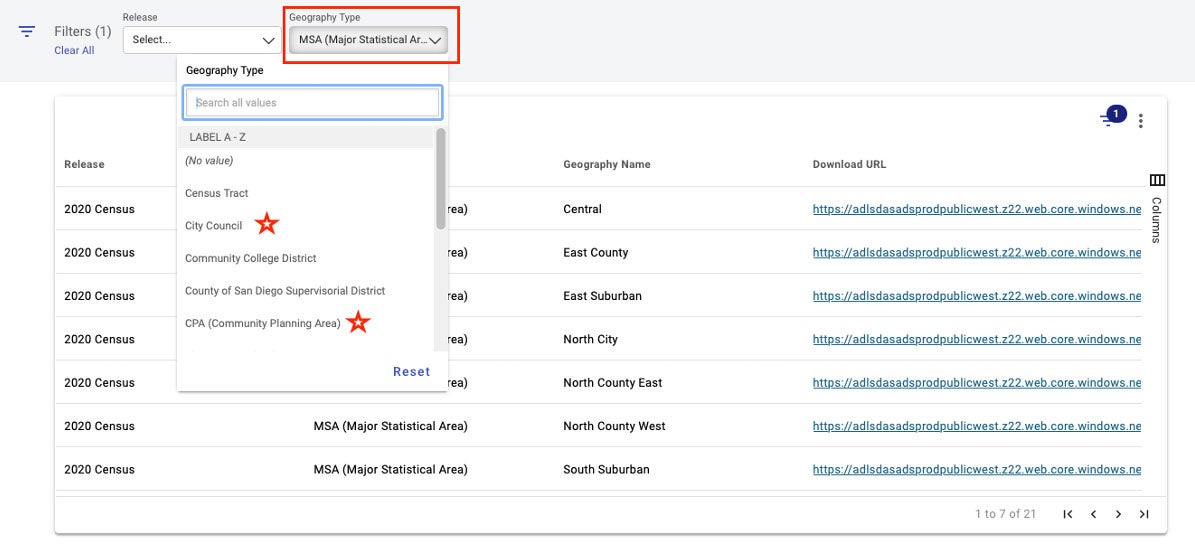
In the filter bar, select the type of geography that is being analyzed. For community-level projects, this will likely be Community Plan Area (CPA). For neighborhood-level projects, this will likely be Census tracts.
Once the geography is selected, use the ‘Geography Name’ column to find the geography that is being analyzing. Click the URL in the ‘Download URL’ column to retrieve the PDF report with the demographic data.
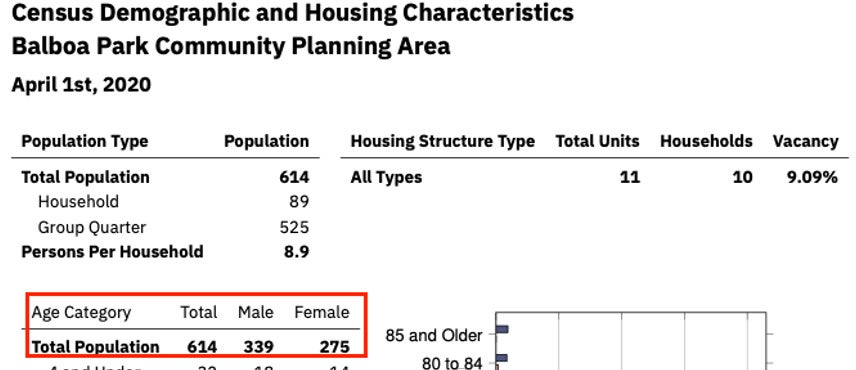
- Retrieve the specific demographic data of interest.
- Relevant demographic characteristics may include age categories, gender identity and race/ethnicity.
The PDF data is raw count data (#). This count data should be converted into a proportion for comparison with the engagement event's participants. To convert the raw count into a proportion, take the count of the demographic category (e.g., Female - 275) and divide it by the total population (e.g., Total - 614) The resulting percentage is the proportion. (275/614 = .447 or 44.7%)
- If all the data needed for the analysis are retrieved, stop here. If a spreadsheet format, such as an Excel or csv file, are needed, continue to learn how to retrieve raw tabular data.
- Retrieving Census raw tabular data
Click the 'Data Catalog' link.
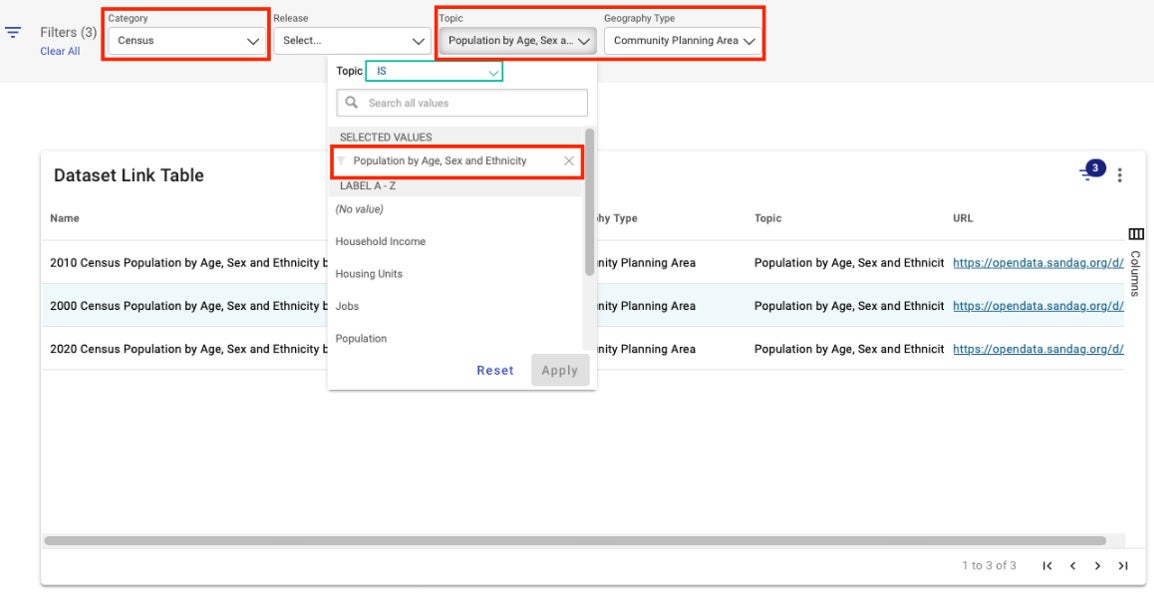
- In the Filter bar, select the category, topic and geography type.
- Select Category as “Census”
- Select Topic as “Population by Age, Sex, and Ethnicity”
For Geography, select the type of geographic area staff will be analyzing. For community-level projects, this will most commonly be Community Plan Area (CPA). For neighborhood-level projects, this will most commonly be Census tracts.
- Verify that the most up-to-date Census data is being used by looking at the name.
- Click the URL in the URL column to be taken to the dataset page.
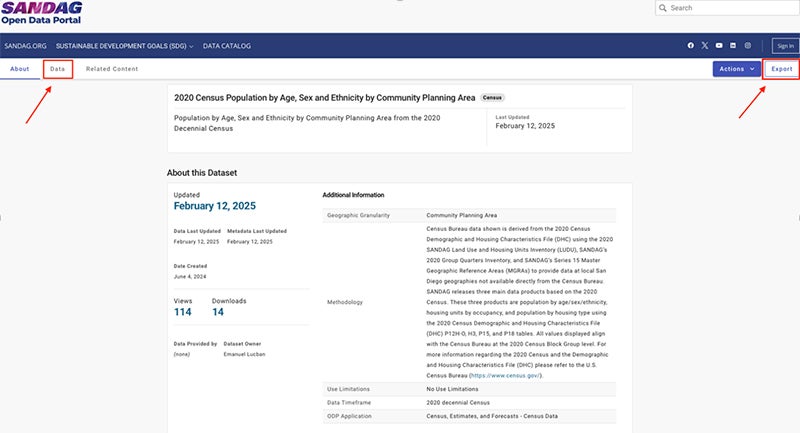
- Retrieve data from the dataset page.
- Preview the data by clicking on the “Data” tab in the upper left-hand side of the webpage.
Download the raw data by clicking the “Export” button on the upper right-hand side of the webpage.