Complete Communities: Mobility Choices
The Complete Communities initiative sets the City on a path to achieve our vision of equitable, healthy, and sustainable neighborhoods, with a focus on four key areas: housing, mobility, parks and infrastructure.
![]()
Mobility Choices
Mobility Choices
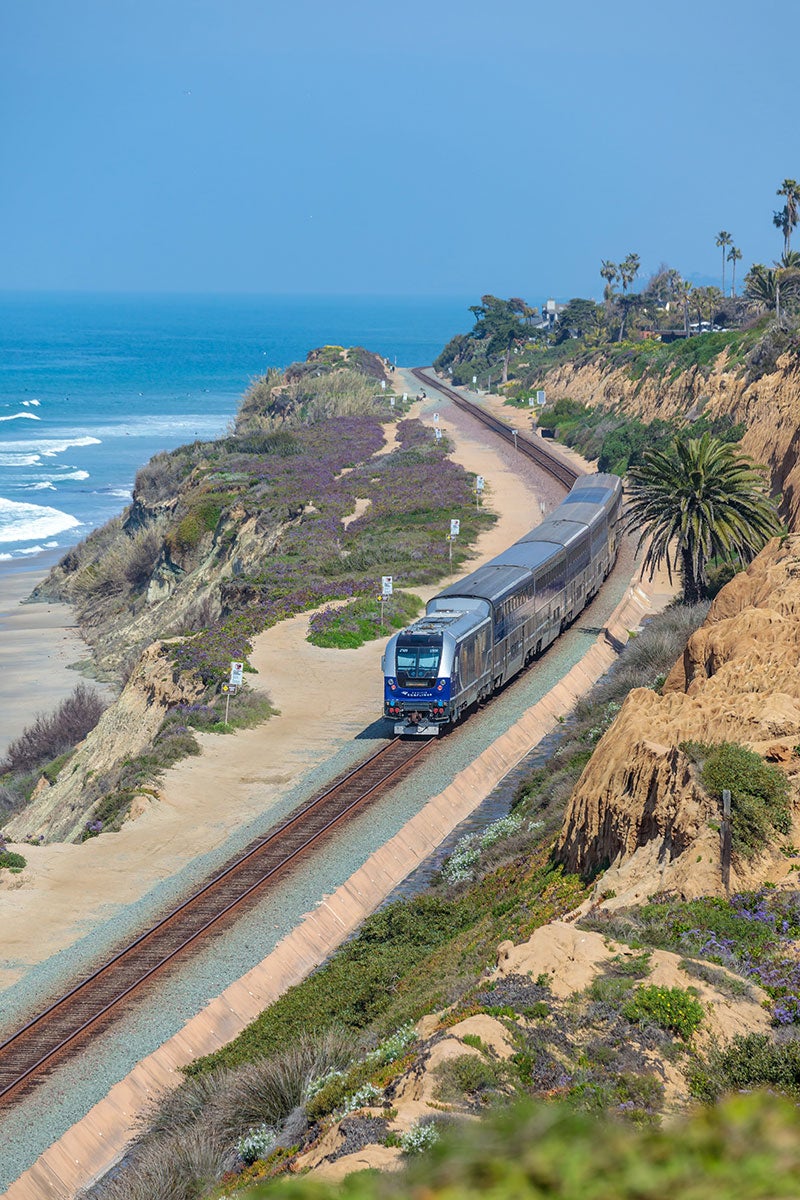
Mobility Choices aims to connect every San Diegan with safe and convenient mobility options that can reliably connect them to jobs, shopping, services, parks, open spaces and other amenities
Mobility Choices Goals:
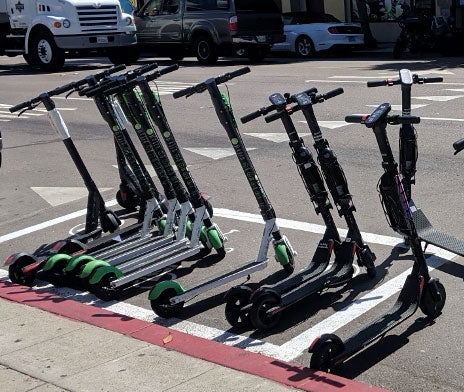
- Provide San Diegans with more mobility options for commuting and recreating
- Provide safe and convenient transportation choices
- Promote a healthier, more active lifestyle
- Reduce greenhouse gas emissions and support clean air for all
![]()
Why Mobility Choices?
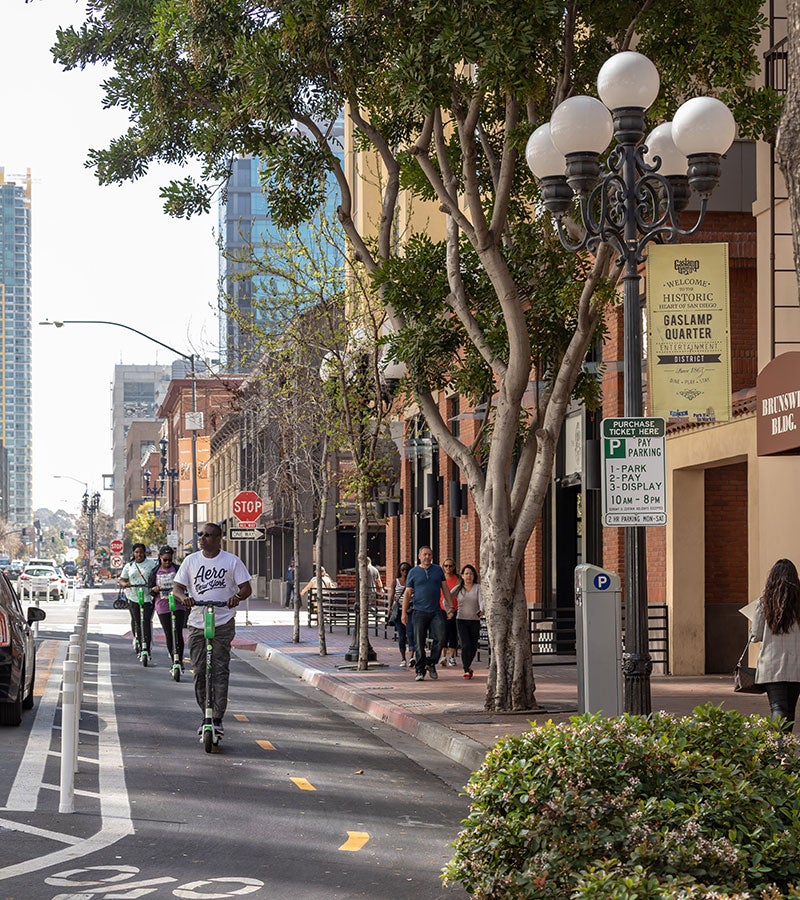
Why Mobility Choices?
- SB 743 requires the City to adopt a new metric for analyzing transportation impacts to achieve a reduction in vehicular traffic (vehicle miles traveled), rather than accommodating additional traffic (level of service)
- The City's Climate Action Plan identifies strategic land use planning, by placing most of the City's new housing close to transit, as a significant source of Citywide greenhouse gas emissions reductions
- Mobility Choices tailors requirements of SB 743 to best implement the City's climate goals
Moving from LOS (Level of Service) to VMT (Vehicle Miles Traveled):
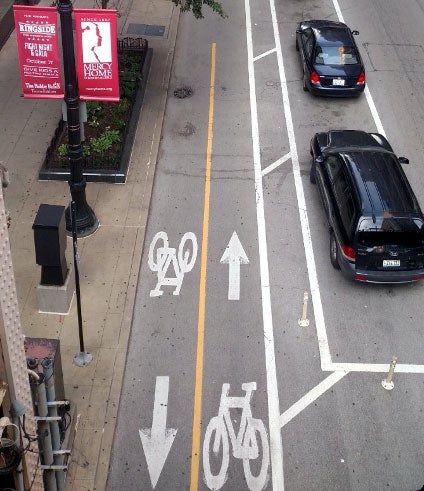
LOS - Encourages additional vehicle travel; limited opportunities to reduce the need for vehicle trips through investments in biking, walking, and transit.
VMT - Encourages investments in biking, walking, and transit that reduce vehicular travel.
(VMT = number of trips X length of trips)
Climate Action Plan Implementation
Planning for Investments that Matter
Mobility Choices Components
Mobility Choices Components
Mobility Choices includes:
- Land Development Manual Amendments
- New Mobility Choices Regulations
- Active Transportation In Lieu Fee
- VMT Calculator
As required by SB743, the City is proposing to update its CEQA Significance Determination Thresholds for Transportation in the Land Development Manual. The update includes new thresholds that account for increases in VMT, consider any conflicts with existing City plans or policies relating to the transportation network, and maintains safety and necessary emergency access.
The Transportation Study Manual (TSM) is also proposed to update the City's current Transportation Impact Study Manual. The TSM provides detailed CEQA transportation analysis guidelines using VMT based metrics to determine a project's environmental impacts with a focus on increasing safety for bicycle, pedestrians, and transit.
Mobility Choices is a programmatic approach to ensure Citywide VMT reductions. The Active Transportation Measures (Appendix T) and the Active Transportation In Lieu Fee are implementing components of the ordinance.
For more information, visit the Complete Communities website.

Mobility Choices Regulations
Mobility Zones
Mobility Zones
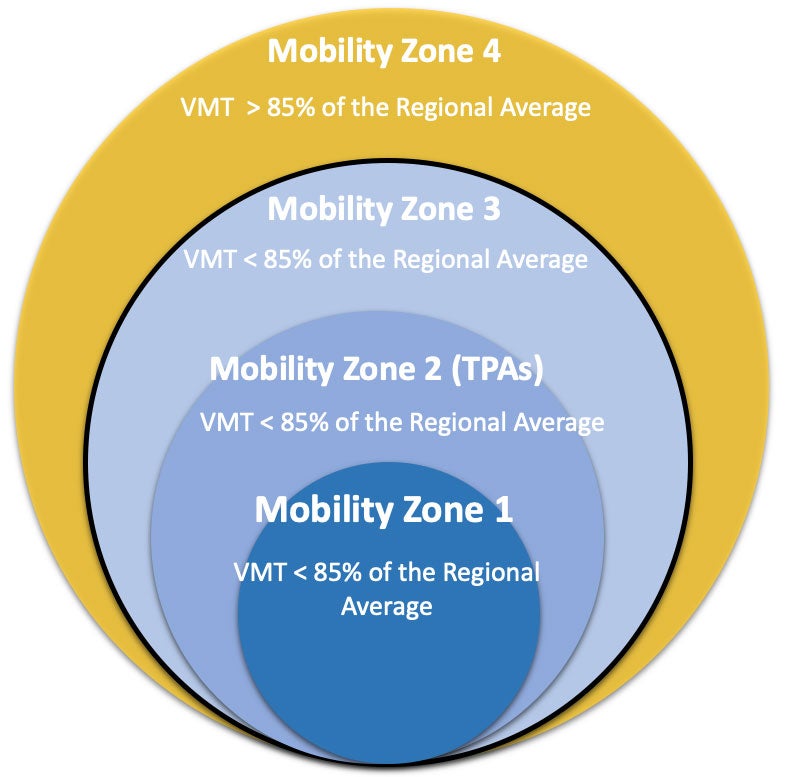
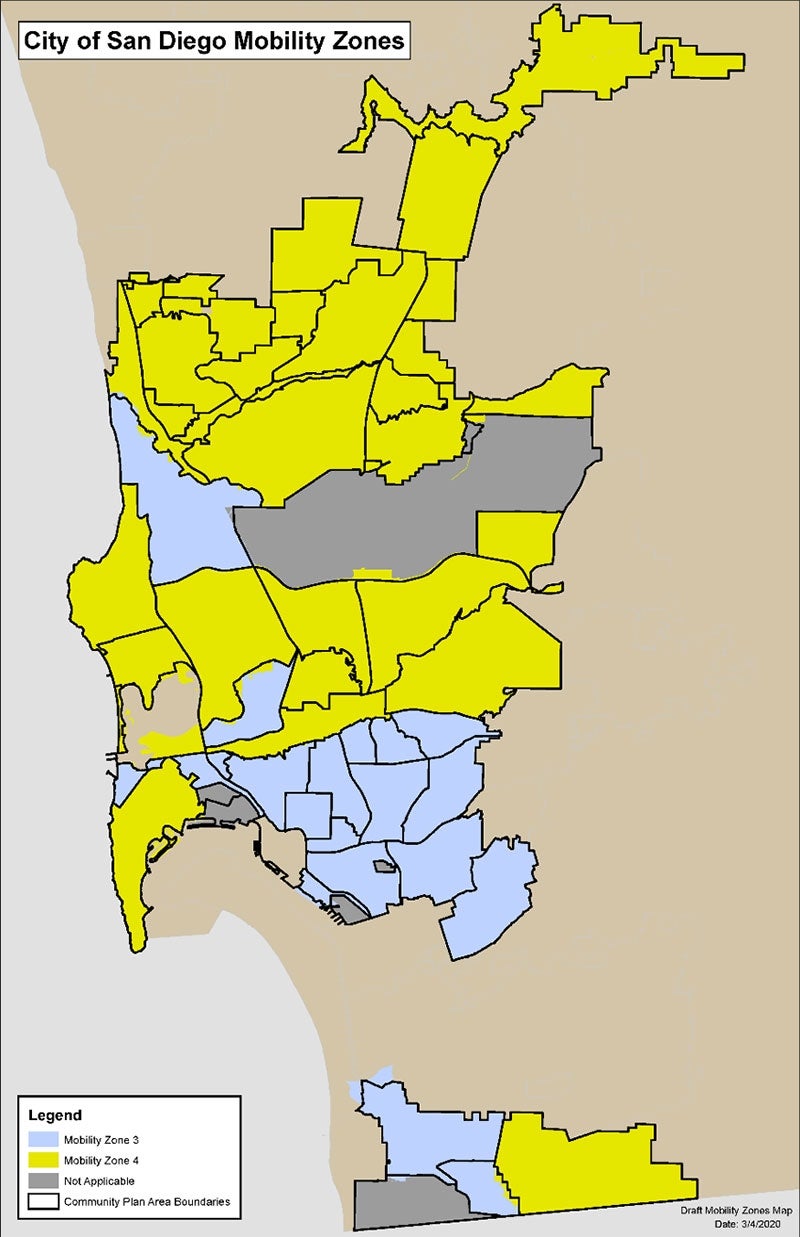
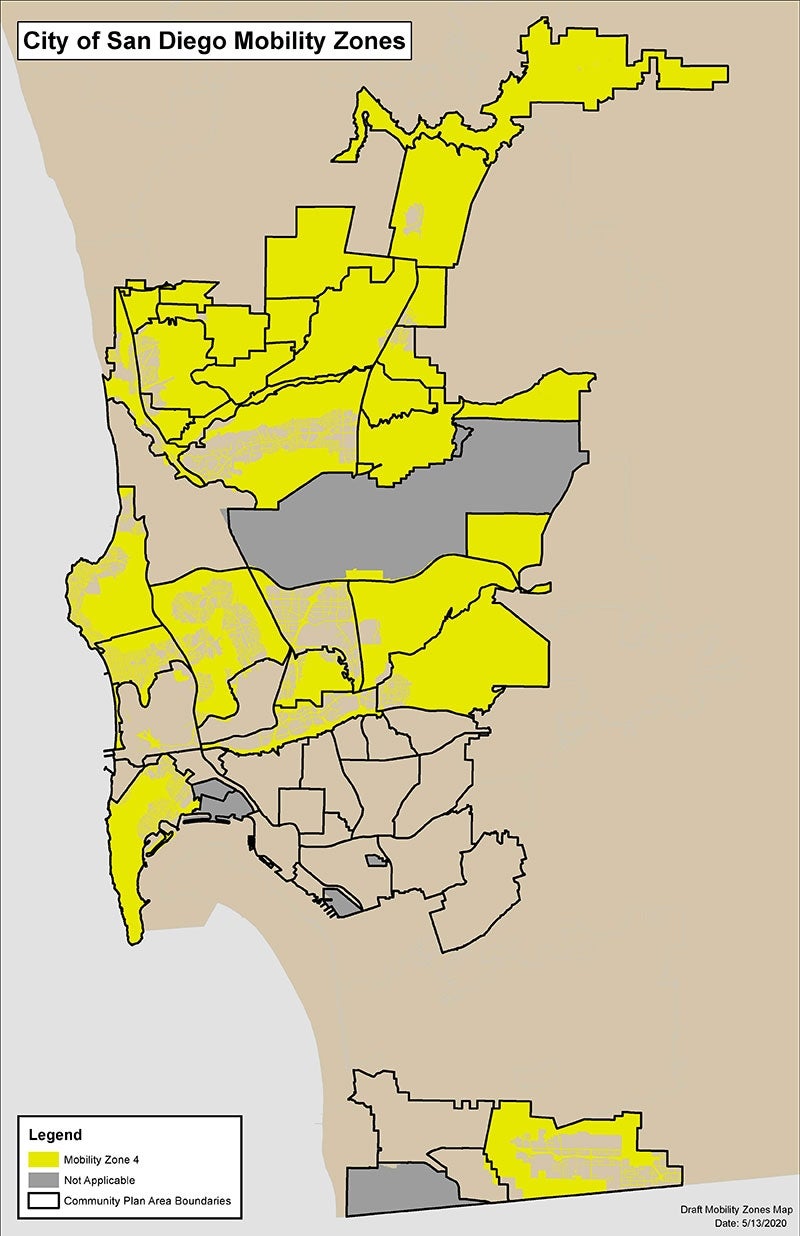
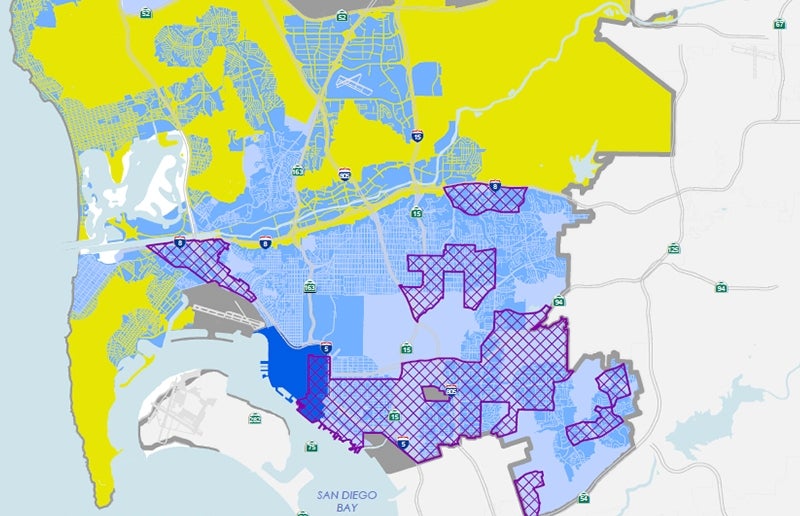
The City was broken out into Mobility Zones. Mobility Zones were designated based on VMT-reducing potential of new development. Investments in VMT efficient areas give the City the greatest potential for VMT reductions at the lowest costs.
Mobility Zones 1, 2, and 3 are VMT efficient; the average number of vehicle miles traveled per capita or per employee is less than 85% of the region.
Mobility Zone 4 is VMT inefficient; the average number of vehicle miles traveled per capita or per employee is greater than 85% of the region.
Full details of the regulations are available on the Complete Communities website.
 85% of the Regional Average.
Mobility Zones 1, 2, and 3 have greater VMT-reducing potential. Mobility Zone 4 has less VMT-reducing potential.
Active Transportation Measures
Active Transportation Measures
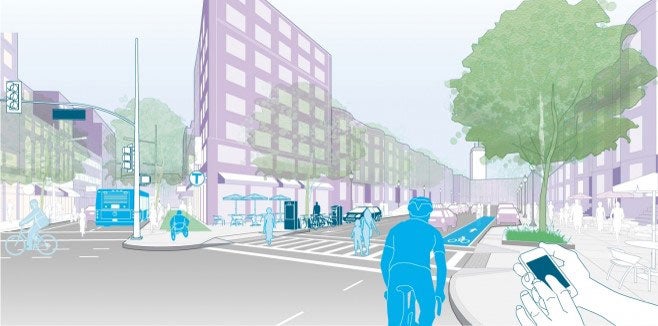
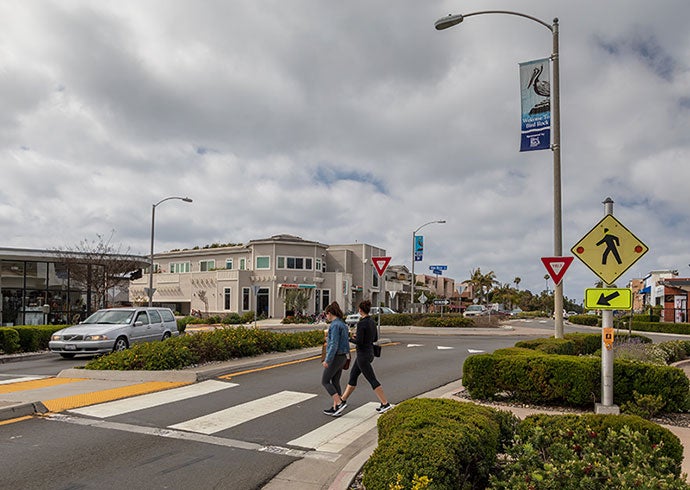
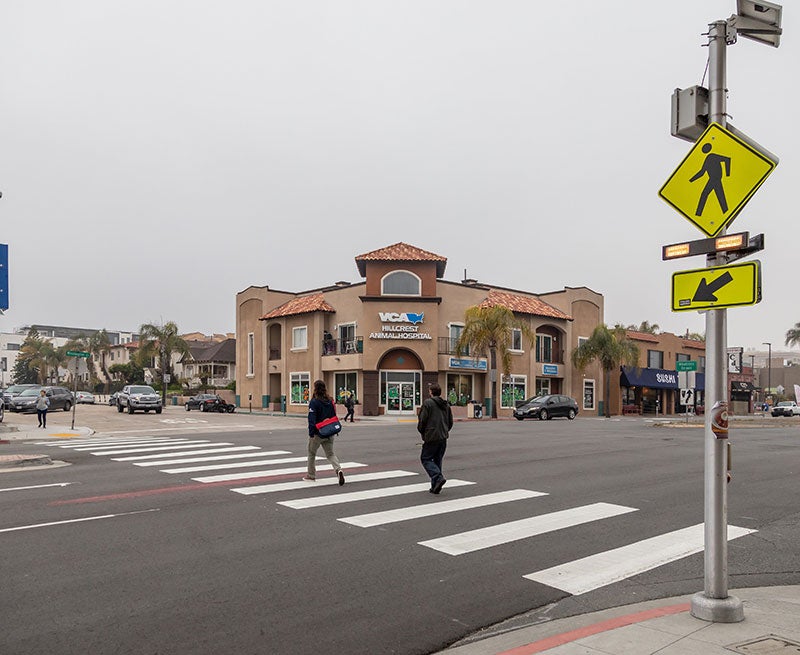
Active Transportation Measures includes improvements such as:
- Pedestrian-scale lighting along public walkways High-visibility crosswalk striping at adjacent intersection
- Pedestrian refuges and raised crosswalks
- Shade trees
- Pedestrian resting and/or recreation areas near public walkways Sidewalk widening
- Transit stop upgrades
- Designated car-share or carpool vehicle parking
- Electric bicycle charging stations
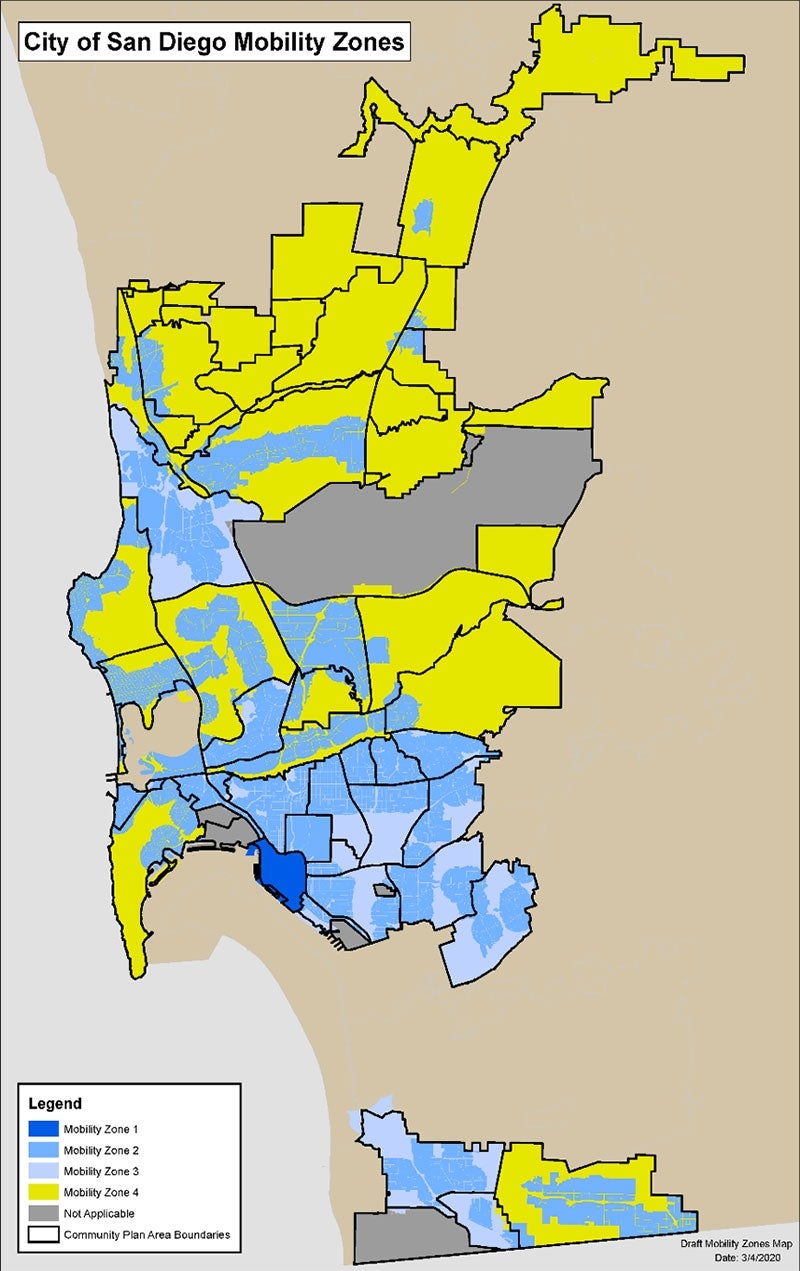
Mobility Zone 1
Mobility Zone 2
Mobility Zone 3

Mobility Zone 4
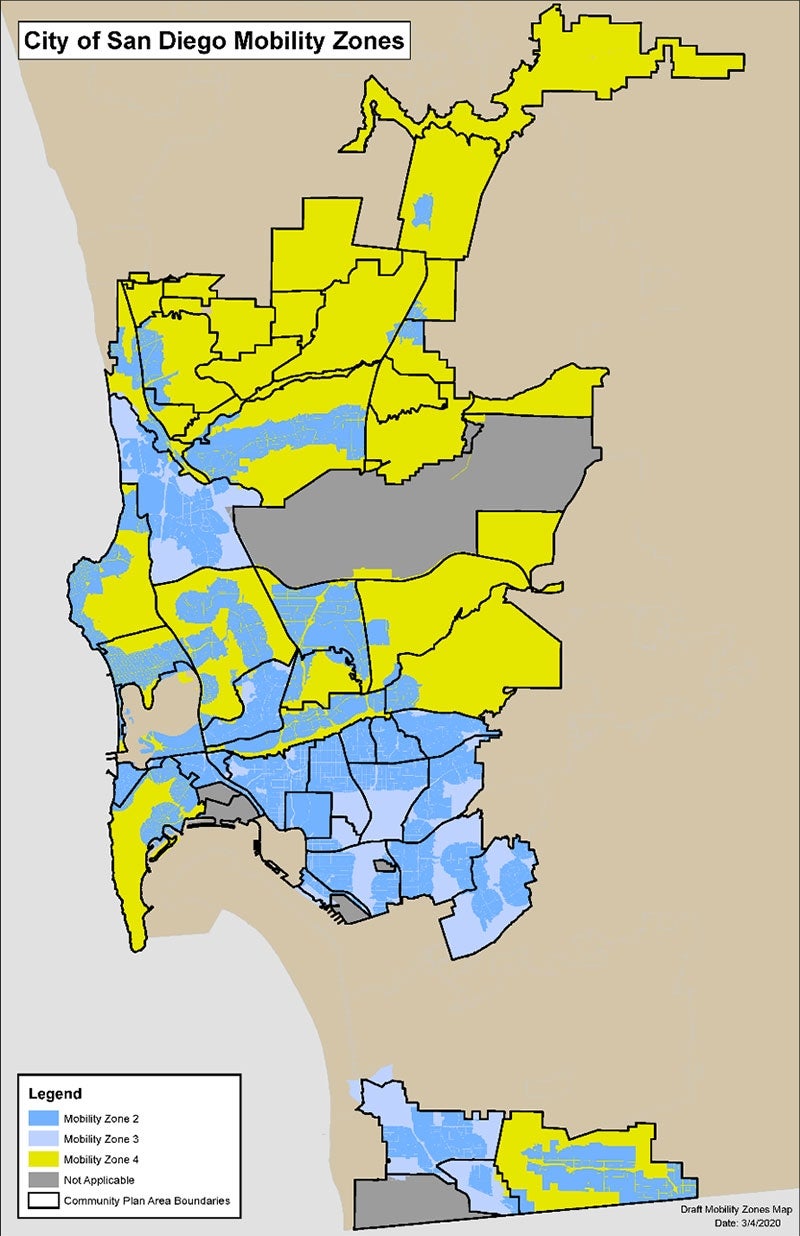
Mobility Choices Active Transportation In Lieu Fee
Mobility Choices Active Transportation In Lieu Fee
- Required in Mobility Zone 4 and optional in Mobility Zones 2 and 3 in-lieu of required Active Transportation Measures
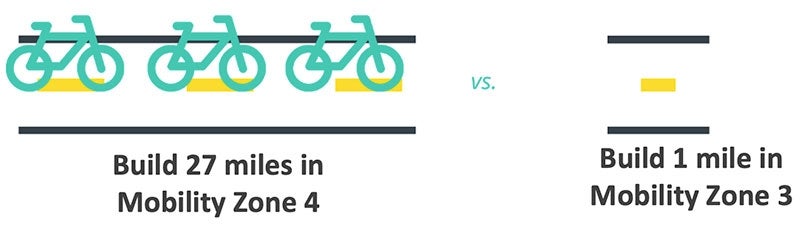
- Investing in VMT reducing infrastructure in Mobility Zone 4 yields the least amount of Citywide VMT reductions
- Instead, it is cheaper and more efficient to invest in VMT reducing facilities in Mobility Zones 1, 2 and 3
Each mile of bike lane or sidewalk improvement invested in Mobility Zones 1, 2 or 3 can serve many more people and destinations, which will lead to greater reductions in Citywide vehicle-miles traveled and more walkable, livable neighborhoods.
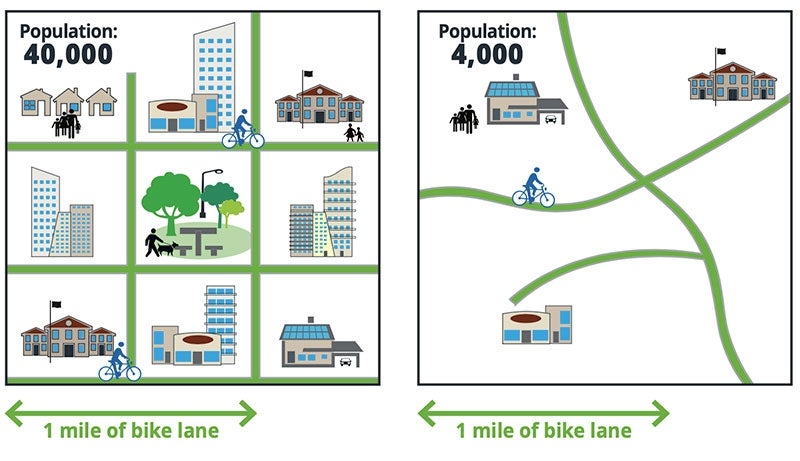
You would have to build 27 miles of bike lane in Mobility Zone 4 to get the same VMT reductions as 1 mile of bike lane in Mobility Zone 3! We want to build bike lanes where they will be used the most.
For additional details on fees, visit the Complete Communities website.
Certain projects will be exempt, regardless of Mobility Zone, including:
- Affordable Housing
- Redevelopment
- Locally Serving Retail
- Locally Serving Public Facilities
- Certain Mixed Use Projects
- Certain Small Projects
- Most Industrial Projects
Mobility Choices & Equity
Mobility Choices & Equity
- Direct walking, biking, and transit improvements in areas that need it most.
- At least 50 percent of all new funds will be spent solely within Communities of Concern
Mobility Choices is part of the City of San Diego's Complete Communities initiative. For more information on Complete Communities please visit:
Other Elements of Complete Communities include:
The draft documents are posted on the City's website and are available by clicking the button below:
Draft Mobility Choices Information
If you have additional questions or feedback, please contact Project Manager, Julia Chase, at JLChase@sandiego.gov