


When a light goes out in your home, you usually just unscrew the old bulb and screw in a new one. At the City of San Diego, we wish it was that easy to do when a streetlight goes out. Should it take us an average response time of more than 300 days to fix a streetlight outage? Absolutely not. City leaders, electricians, and data analysts are committed to decreasing that response time and reducing the backlog of nearly 5,000 nonfunctional streetlights in communities across San Diego.
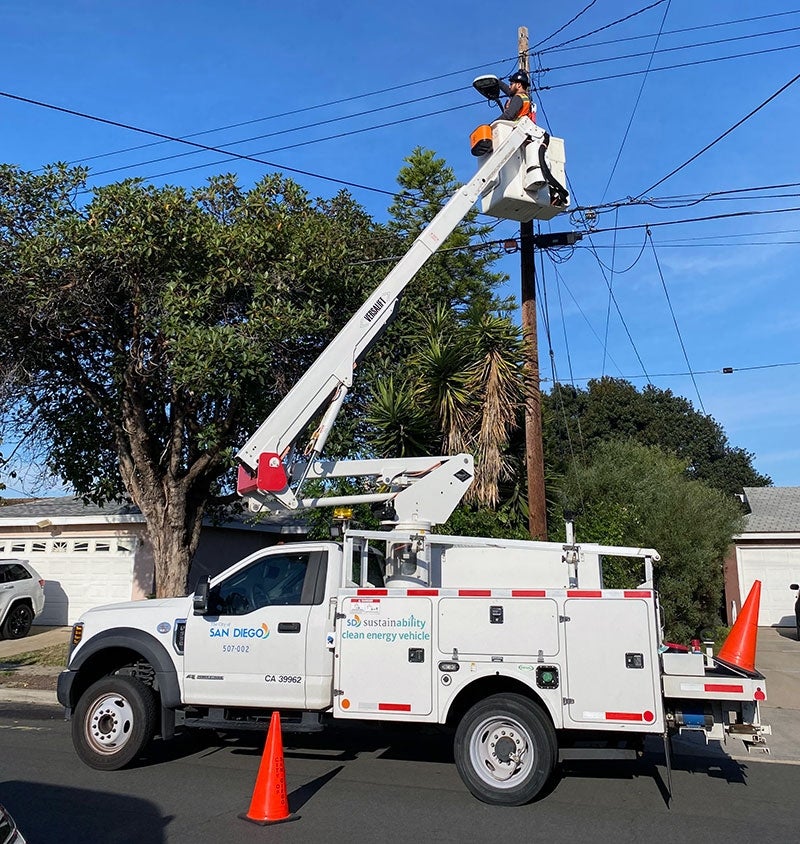
Today, the City employs 11 highly skilled, dedicated electricians…and we’re looking to hire more (complete with higher salaries than years past and a new pension option). Filling vacancies is one way to fix streetlights faster, but it’s not the only way. The City’s Performance & Analytics Department is teaming up with the Transportation Department to better understand variables and use pertinent data to inform the processes of fixing streetlights in ways that are efficient, effective, and equitable. One example of this collaboration includes creating real-time maps to reveal corridors or groupings of streetlight outages that need work in each City Council District and make best use of our electricians’ limited time. This is just one factor in the Transportation Department’s new prioritization methodology.
To prioritize work orders, this methodology uses data variables like location (for example, is the streetlight near a school or in a park?); residential density; traffic and accident volume; crime rates; historic service levels; and more. This data is aggregated and analyzed by City employees to assign work orders systematically and thoughtfully in each City Council District. In general, every four weeks, two teams of electricians spend time tackling the corridors or groupings of streetlight outages in two different districts. During the following four weeks, each team rotates to another district to ensure every community has working streetlights illuminating their neighborhoods. This process is repeated once assignment areas in all nine districts have been covered.
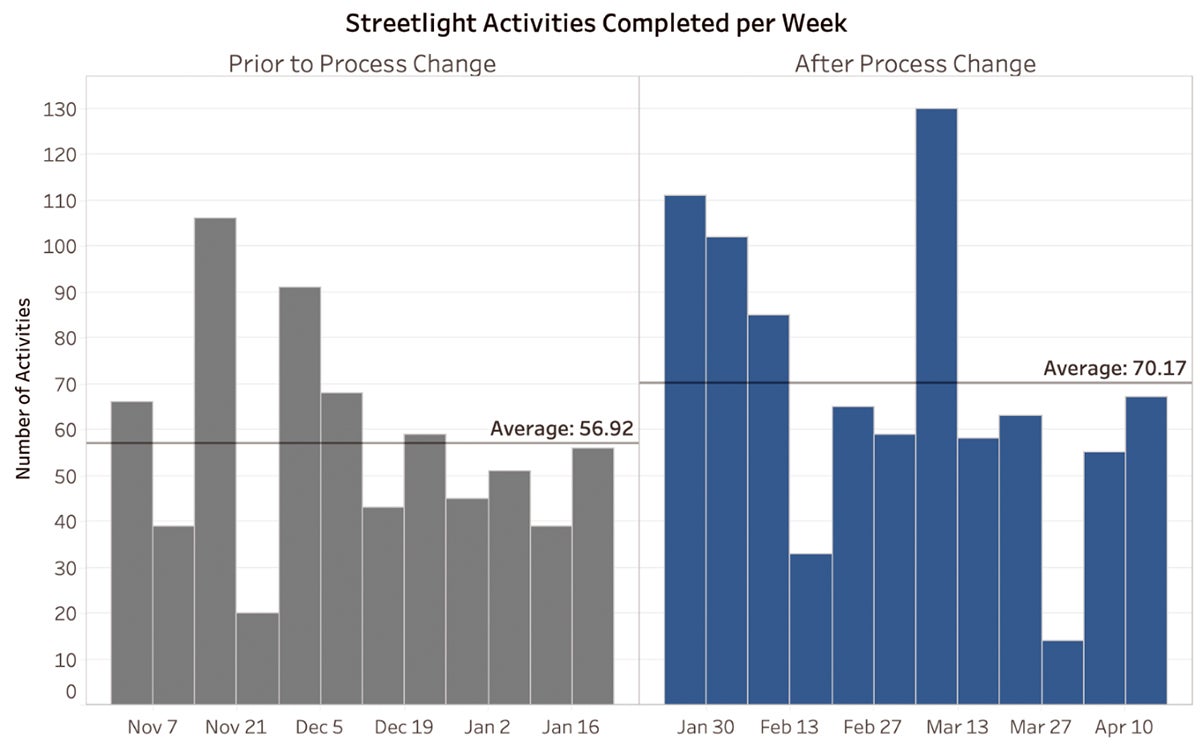
The graph above shows a 23% increase in the average number of streetlight activities completed each week over the course of 12 weeks, as compared to the 12 weeks prior to the implementation of process improvements. Kudos to our teams for their progress so far!
While a lot of the complexities of fixing streetlights – aging infrastructure, block outages, series circuits, damaged and stolen wires, etc. – will still exist, we are optimistic that filling vacancies, increasing staffing, and improving processes will help significantly reduce response times and reduce the streetlight backlog. If you see a streetlight out in your neighborhood, please submit a report on Get It Done with the correct information, location, detailed description, photographs, and appropriate “Streetlight” report type. You can check the status of your report here, and learn more about the City’s Transportation Department and Performance & Analytics Department on their websites.
//