


Tools
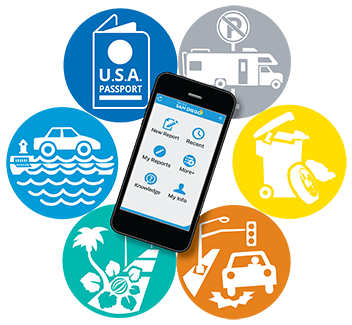
Get It Done
Get It Done provides simple and easy ways to connect with the City. Report non-emergency problems, schedule appointments or obtain information through the Get It Done mobile application, or Get It Done webpage. This tool enables the City to utilize CRM software to efficiently process incoming reports. Valuable customer and employee feedback is collected to inform future improvements and enhancements.
![]()
StreetsSD
StreetsSD allows residents to view street condition and repair data for San Diego’s entire 3,000-mile street network
![]()
DataSD
DataSD creates a more open and transparent city government. The open data portal provides over 75 datasets to make City operations more transparent and effective and to allow the public to assist in identifying efficient solutions for government. DataSD promotes civic engagement, allows for more effective communication with our communities and through predictive analytics, improves service delivery and increases opportunities for economic development.
Open Data Policies and Reports
![]()
OpenGov
OpenGov provides a visual presentation of the City's proposed annual budgets. Designed collaboratively by Performance & Analytics Department and the Department of Finance this tool makes an unprecedented amount of information to the public available. The data behind this visualization comes from the City's SAP-based financial management system.
![]()
PerformSD
PerformSD displays charts, graphs and other types of infographics, making large volumes of the City's complex data easier to understand. At a glance, users can gauge the City's performance on issues, better understand how the City is serving the public, identify areas for improvement, and promote decision-making based on data. Features include metrics from the following areas: recreation and culture, public safety, infrastructure, sustainability, transportation and mobility, economy and finance, civic engagement, communication, and customer service.