Inclusive Engagement Techniques and Approaches
Community Mapping
What is it?
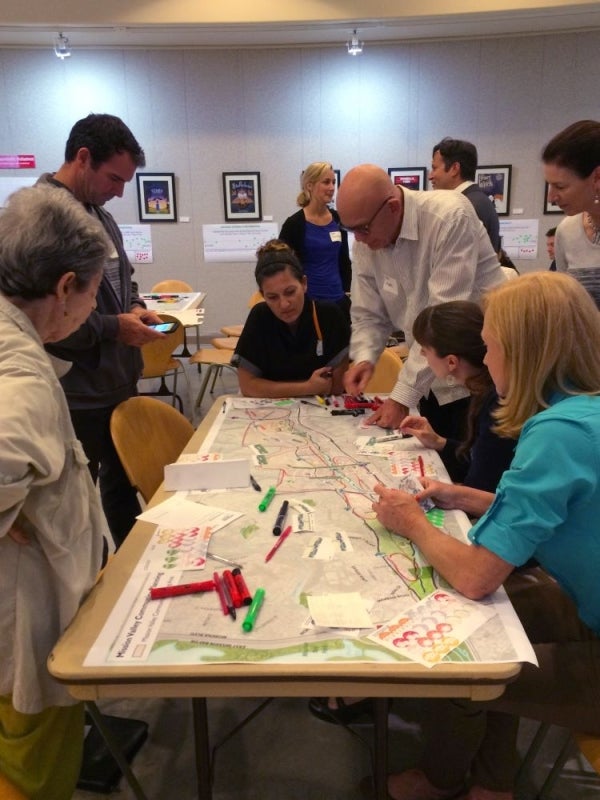
Community mapping is using maps to understand relationships between people, nature and buildings. It can involve identifying issues, patterns, opportunities and constraints related to a geographic area. Common formats for community mapping include:
- Traditional Approach: In this method, large-scale maps are printed, and people are invited to place sticky notes, dots or other items on the map in response to specific questions.
- Mental Maps Approach: This approach encourages people to draw their own community maps. Participants can identify landmarks, barriers, edges, nodes and districts based on their perceptions. It can make community mapping less technical and more user centered.
- Digital Map/Crowdsourcing Approach: Using a digital platform, people contribute information, observations and other comments on a web-based shared map related to a specific topic.
When to use it
Community mapping is useful to understand community members’ perceptions regarding a place and their lived experiences. Mapping exercises can gather detailed input to identify areas within a community that could benefit from new projects or interventions, assess the effectiveness of current projects and/or identify areas that require attention.
How to do it
Before
- Decide the area that the map will show and which elements will be highlighted on the map (e.g. streets, open spaces, commercial areas, landmarks, neighborhoods).
- Make the map using tools such as ArcGIS, Google Maps or Adobe Illustrator.
- If choosing a Digital Map/Crowdsourcing Approach, consider using a platform that is geo-enabled where ideas and feedback can be captured directly into a geodatabase via the on-screen digital map.
- Esri tools are the most commonly used for these types of maps. Consider using Survey123 or ArcGIS Portal Web Maps for collecting geospatial data via an online map. Contact the Department of Information Technology, Performance & Analytics Department or the department’s Information Systems Analyst for assistance with these types of maps.
- Create prompt questions or instructions for the map activity to gather the type of quantitative or qualitative input desired.
- Consider standardizing the questions and options with a specific legend or categories for responses and input to improve the integrity of the information collected and enable better analysis.
- Decide if map will be printed (accessible to City staff only) or displayed virtually for online engagement.
- Post the map onto the project webpage as needed.
- Static maps online should be in PDF format 300 pixels per inch (ppi) or higher
- Digital maps should be hosted from the City’s ArcGIS Portal environment and data sourced to authoritative sources as much as possible such as SanGIS. Consult with the Department of Information Technology (accessible to City staff only) and/or the department’s Information Systems Analyst as needed.
- Post the map onto the project webpage as needed.
- Conduct outreach to invite and encourage participation, such as using email notifications, flyers or social media.
During
- Present the map to participants and explain its components. Share how participants can provide input.
- Record participants’ input and take photos of the final map.
- Note any next steps or future opportunities for engagement.
- Optionally allow participants to share feedback about the community mapping activity through participant satisfaction surveys.
After
- Compile the data into a comprehensive format to identify patterns, trends and key themes to understand the public’s needs, opportunities and constraints.
- For digital maps with location-based data, consider storing this data in a geodatabase or hosted feature service.
- Consult with Department of Information Technology’s GIS team or Performance & Analytics Department for further guidance.
- Share any findings, reports and follow-up information with participants and stakeholders.
Resource considerations
![]()
Cost: Minimal to Moderate
Smaller maps or digital-only versions generally have minimal costs or are free. The cost to print and mount maps depends on the size, thickness and quantity of maps. A license or subscription to digital mapping software may cost several thousand dollars depending on the selected vendor and/or the length of time needed for the engagement.
![]()
Time: Moderate
Designing and printing the map can take about a month. Simple digital maps or minor updates can be completed more quickly. Setting up an interactive digital map platform is more time-intensive.
![]()
Capacity: Minimal to Moderate
Creating a simple map requires one to two staff. Larger projects or those requiring extensive community engagement may need three to four staff to create the map, facilitate the activity and analyze input.
Other considerations
- Consider the map’s size and check that it fits within the vehicles used for transportation. If planning individualized mapping activities, supply clipboards with small map print-outs.
- Multiple maps can be used in a workshop or open house setting to obtain input on a variety of topics such as understanding where potential park opportunities are in a community, which streets have a lot of speeding traffic or where barriers and access issues to public facilities and services exist or are perceived.
- Consider any audiovisual needs (projector, microphones, screen, etc.) for the mapping activity.
How to make it more inclusive
- Check that maps follow document accessibility best practices and that important components of the map are easy to spot.
- Consider conducting community mapping activities at different times of day/days of the week to accommodate different schedules.
- Use clear, simple and inclusive language.
- Translate materials and provide interpretation services as needed.
- Consider providing participation support.
Inclusive Engagement Techniques and Approaches
- Introduction
- Appreciative Inquiry
- Arts-based Engagement
- Briefings
- Comment Forms
- Community Cafés
- Community Mapping
- Community Office Hours
- Email Notifications
- Engagement through Service
- Fact Sheets
- Flyers
- Focus Groups
- Game-based Approaches
- Hotlines
- Information Kiosks
- Interviews
- Meeting in a Box
- Mobile Engagement
- News Releases
- Newsletters
- Open Houses
- Participation Support
- Pop-Up Events
- Project Models
- Project-specific Groups
- Public Meetings
- Public Service Announcements (PSAs)
- Social Media
- Surveys and Polls
- Tours and Field Trips
- TV/Radio/Podcast Interviews
- Vision Walls
- Web-Based/Hybrid Meetings
- Webpages
- Workshops