Inclusive Engagement Techniques and Approaches
Surveys and Polls
What is it?
Surveys and polls can solicit and assess the public’s opinions regarding projects. Both techniques should use clear and unbiased questions to prompt responses from the public through online or in-person formats.
Polls consist of a single question or a short set of questions that provide surface-level insight into public sentiment. Surveys are longer and more detailed than polls, giving more in-depth insight into public perception. Both can be formal or informal and made statistically significant and representative.
When to use it
Surveys and polls can be used to gather public input at any time during the public engagement process to assess sentiment from large amounts of people. Repeated surveying or polling can be useful to understand changes in perception over time.
Polls can be used to determine people’s preferences between pre-established options while surveys are used to assess how people prioritize proposed options, evaluate performance or understand an idea. Results from surveys can help staff understand how people are impacted by projects and inspire new ideas for decision-makers.
How to do it
Before
- Define key problems and questions that survey or poll results will answer.
- Determine the audience and what the timeline is for soliciting responses. Surveys are typically open for at least one month. Identify any translation needed for the survey or poll audience in advance.
- Assess early on whether results would have significant weight in the decision-making process. If interested in generating statistically significant surveys or polls (in which the results are likely to be true for the larger population), work with the City’s Performance & Analytics Department. Otherwise, the surveys or polls should not be regarded as statistically significant or representative.
- Draft an introduction that explains the context and purpose of the survey or poll, including how the data will be used.
- Reference the Survey Standards and Practices Policy (accessible to City staff only) to write unbiased, non-leading questions using clear, simple and inclusive language.
- Surveys should have no more than 15 questions; less is better. The more questions they encounter, the less likely people are to complete the survey.
- Questions should have a logical flow, moving from general questions to more specific ones and grouping similar items together.
- Each question should have a clear purpose. Define what actions would be taken based on responses.
- Avoid leading questions.
- For example, the question, "Do you want to see more trees in your neighborhood?", which has a yes or no answer, leads the respondent to a desired answer. The question should instead ask, "How do you feel about the number of trees in your neighborhood?" Response options could include:
- I would like to see more trees
- The current number of trees is fine
- I would like to see fewer trees
- For example, the question, "Do you want to see more trees in your neighborhood?", which has a yes or no answer, leads the respondent to a desired answer. The question should instead ask, "How do you feel about the number of trees in your neighborhood?" Response options could include:
- Questions should be closed-ended to invite focused, applicable answers.
- For example, the question, "Tell us everything you think about the proposed park,” is open-ended. The question could instead state, "What is your main concern about the proposed park?” or “What feature is most important to you in the proposed park.” A list of options can accompany closed-ended questions to provide focused answers.
- Consider if a survey needs demographic questions. Consider using 3D elements like building blocks, simple models and figurines to help guide visioning exercises for visual and tactile learners.
- The City collects demographic information to better serve all San Diegans. Data shows some groups have not benefited equally from City of San Diego services. By asking these questions, we can see who we are reaching, who we may be missing, and measure progress toward creating participation opportunities for everyone.
- See Performance and Analytics’ Standard Demographic Questions (accessible to City staff only) for more information.
- The City collects demographic information to better serve all San Diegans. Data shows some groups have not benefited equally from City of San Diego services. By asking these questions, we can see who we are reaching, who we may be missing, and measure progress toward creating participation opportunities for everyone.
- Create proper formats for responses.
- Circular, radio buttons are best when a question warrants a single answer and check boxes are best for questions with multiple answers.
- Include an open field with enough characters for “Other” answers for respondents to provide a meaningful answer.
- Share the survey/poll with the Performance & Analytics Department for review. Also, consider testing with staff not directly involved in the project to check for any biases.
- Draft a conclusion that acknowledges respondents’ efforts, provides links to applicable privacy policies and outlines follow-up actions such as where results will be available and how people can stay engaged in the project.
- Consider providing participation support for longer surveys to increase response rates and reach people who are less likely to respond.
- Work with the Performance & Analytics Department to choose and prepare the poll or survey platform. Medallia is the recommended platform because it offers robust data security and allows for consistent data management. Departments can work with Performance and Analytics to prepare surveys or polls in Medallia. See Survey Platforms below for additional platform recommendations.
During
- After survey or poll launch, share it through techniques such as social media, the project webpage, flyers and at pop-up events.
- In communications, include how the City will use the results and share the survey or poll’s close date.
- Consider directly contacting organizations and groups that may be particularly interested in the topic.
- Monitor response demographics and encourage participation from stakeholders to best achieve responses that are representative of the community.
After
- After the survey or poll closes, compile and analyze the data for decision-makers; request support from the Performance & Analytics Department for this as needed.
- Consider sharing survey results with the public.
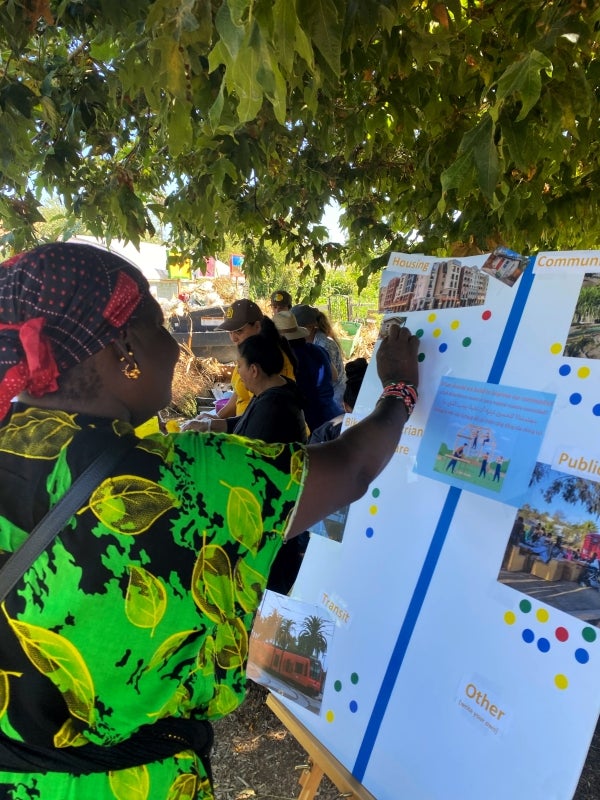
Visual preference surveys
Visual preference surveys are a type of survey that showcase various project options via graphics/images so that participants can indicate their preferred choices. They have clear input prompts that communicate project options to participants. Visual preference surveys can be used with other outreach and engagement techniques like open houses, web-based meetings or workshops.
In addition to survey and poll considerations, consider the following for visual preference surveys:
Before
- Options for implementing visual preference surveys include virtual platforms, using large-scale format printed boards during in-person meetings or designing booklets for participants to fill.
- Image options should be uniformly sized and have similar composition, color saturation levels and pixel resolution.
- Use realistic imagery, ideally taken at an eye level (e.g., photographs from real projects/products). Avoid computer generated imagery (CGI) or artificial intelligence (AI)-generated imagery.
- Leave space next to each image for people to put stickers.
During
- Staff should explain the process for the visual preference survey and what the images represent.
- Instruct participants not to cover the pictures with their stickers.
- Inform participants that it is an individual exercise meant to solicit their own thoughts as opposed to a group discussion.
- Give each participant a set number of stickers based on input needed. For example, when evaluating 10 project options, provide five green stickers for top choices and five blue stickers for second choices.
After
- Collect all visual preference surveys and digitize them as needed.
Resource considerations
![]()
Cost: Minimal
Surveys or polls have minimal hard costs because the City maintains access to surveying and polling software such as Medallia. Implementing visual preference surveys at in-person events may involve minimal expenses related to large-format prints or booklets.
![]()
Time: Moderate
Conducting surveys and polls requires up to two months for creation, testing and public outreach efforts. Surveys and polls are typically open for one month.
![]()
Capacity: Minimal
One or two staff members are needed to develop and conduct surveys or polls.
Other considerations
- Surveys or polls capture public input at a specific moment in time.
How to make it more inclusive
- Follow document accessibility best practices.
- Consider testing surveys and polls for compatibility across different devices.
Survey platforms
Surveys or polls conducted by the City will be administered through Medallia whenever possible. The Performance & Analytics Department can support other departments with creating these in Medallia. Medallia offers robust data security and is especially suitable for surveys that collect sensitive information. Recurring surveys should always be conducted using Medallia to ensure consistent data management and security. Medallia securely stores all survey data within the platform, though data can be exported to staff as needed for further analysis or reporting.
For one-off surveys, other tools such as Typeform, Microsoft Forms, Survey123 and Google Forms may be used. These platforms provide flexibility for less sensitive surveys or those that do not require the enhanced security features of Medallia. The Performance & Analytics Department can guide staff in selecting the appropriate platform based on the survey's specific goals, frequency and data security needs.
Inclusive Engagement Techniques and Approaches
- Introduction
- Appreciative Inquiry
- Arts-based Engagement
- Briefings
- Comment Forms
- Community Cafés
- Community Mapping
- Community Office Hours
- Email Notifications
- Engagement through Service
- Fact Sheets
- Flyers
- Focus Groups
- Game-based Approaches
- Hotlines
- Information Kiosks
- Interviews
- Meeting in a Box
- Mobile Engagement
- News Releases
- Newsletters
- Open Houses
- Participation Support
- Pop-Up Events
- Project Models
- Project-specific Groups
- Public Meetings
- Public Service Announcements (PSAs)
- Social Media
- Surveys and Polls
- Tours and Field Trips
- TV/Radio/Podcast Interviews
- Vision Walls
- Web-Based/Hybrid Meetings
- Webpages
- Workshops